Note
Click here to download the full example code or run this example in your browser via Binder
Isotonic Regression
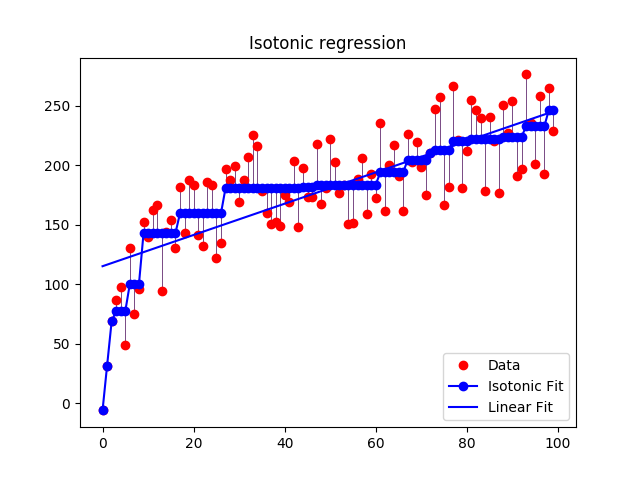
An illustration of the isotonic regression on generated data. The isotonic regression finds a non-decreasing approximation of a function while minimizing the mean squared error on the training data. The benefit of such a model is that it does not assume any form for the target function such as linearity. For comparison a linear regression is also presented.

print(__doc__)

# Author: Nelle Varoquaux <nelle.varoquaux@gmail.com>
#         Alexandre Gramfort <alexandre.gramfort@inria.fr>
# License: BSD

import numpy as np
import matplotlib.pyplot as plt
from matplotlib.collections import LineCollection

from sklearn.linear_model import LinearRegression
from sklearn.isotonic import IsotonicRegression
from sklearn.utils import check_random_state

n = 100
x = np.arange(n)
rs = check_random_state(0)
y = rs.randint(-50, 50, size=(n,)) + 50. * np.log1p(np.arange(n))

# #############################################################################
# Fit IsotonicRegression and LinearRegression models

ir = IsotonicRegression()

y_ = ir.fit_transform(x, y)

lr = LinearRegression()
lr.fit(x[:, np.newaxis], y)  # x needs to be 2d for LinearRegression

# #############################################################################
# Plot result

segments = [[[i, y[i]], [i, y_[i]]] for i in range(n)]
lc = LineCollection(segments, zorder=0)
lc.set_array(np.ones(len(y)))
lc.set_linewidths(np.full(n, 0.5))

fig = plt.figure()
plt.plot(x, y, 'r.', markersize=12)
plt.plot(x, y_, 'b.-', markersize=12)
plt.plot(x, lr.predict(x[:, np.newaxis]), 'b-')
plt.gca().add_collection(lc)
plt.legend(('Data', 'Isotonic Fit', 'Linear Fit'), loc='lower right')
plt.title('Isotonic regression')
plt.show()
Total running time of the script: ( 0 minutes 0.144 seconds)
